HiPerGator Metrics: Difference between revisions
| Line 53: | Line 53: | ||
| | | | ||
===[https://metrics.rc.ufl.edu/d/e6ECgorZz/hipergator-status?orgId=2&refresh=5m&var-cluster=hipergator&var-partition=All&theme=dark&viewPanel=12 GPU Allocation]=== | ===[https://metrics.rc.ufl.edu/d/e6ECgorZz/hipergator-status?orgId=2&refresh=5m&var-cluster=hipergator&var-partition=All&theme=dark&viewPanel=12 GPU Allocation]=== | ||
[[Image:Gpu status.png |right | frameless | | [[Image:Gpu status.png |right | frameless | x125px| link=https://metrics.rc.ufl.edu/d/e6ECgorZz/hipergator-status?orgId=2&refresh=5m&var-cluster=hipergator&var-partition=All&theme=dark&viewPanel=12]] | ||
This panel shows the allocated percentage of GPUs per product family and overall.<br> | This panel shows the allocated percentage of GPUs per product family and overall.<br> | ||
It also displays both the current and average allocation, calculated over the chosen time range.<br> | It also displays both the current and average allocation, calculated over the chosen time range.<br> | ||
| Line 59: | Line 59: | ||
|| | || | ||
===[https://metrics.rc.ufl.edu/d/e6ECgorZz/hipergator-status?orgId=2&refresh=5m&var-cluster=hipergator&var-partition=All&theme=dark&viewPanel=8 Slurm Jobs Started per Minute]=== | ===[https://metrics.rc.ufl.edu/d/e6ECgorZz/hipergator-status?orgId=2&refresh=5m&var-cluster=hipergator&var-partition=All&theme=dark&viewPanel=8 Slurm Jobs Started per Minute]=== | ||
[[Image:Slurm job starts.png|frameless|right | | [[Image:Slurm job starts.png|frameless|right | x125px| link=https://metrics.rc.ufl.edu/d/e6ECgorZz/hipergator-status?orgId=2&refresh=5m&var-cluster=hipergator&var-partition=All&theme=dark&viewPanel=8]] | ||
This panel shows the number of jobs started by the Slurm scheduler every minute.<br> | This panel shows the number of jobs started by the Slurm scheduler every minute.<br> | ||
To view the value of a specific point, you can hover your mouse over a bar.<br> | To view the value of a specific point, you can hover your mouse over a bar.<br> | ||
Latest revision as of 15:53, 10 January 2023
Accessing the HiPerGator Status Dashboard
- You must have a valid HiPerGator account. If you need to request an account, see the Account Request page.
- Use your browser to access https://metrics.rc.ufl.edu
- You will be directed to the UF GatorLink login page (it's possible this step will be skipped if you have already authenticated to other UF resources)
- Once authenticated, you will be shown a Grafana login page
- Enter your GatorLink credentials and click Log In
- You will be directed to the HiPerGator Status dashboard which should have charts like the ones below.
If you do not land on this page, please contact Support or file a Bugzilla ticket.
Dashboard Panels Explained
Number of Users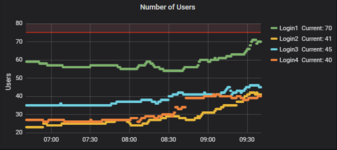 This panel shows the number of users per login node. |
5 Minute Load Average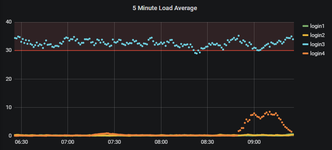 This panel shows the 5 minute load average of each login node. |
CPU Status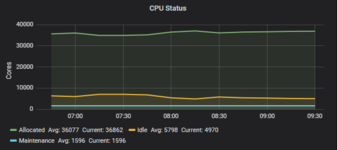 This panel shows the number of CPUs that are allocated, idle and reserved. |
1 Minute Load Average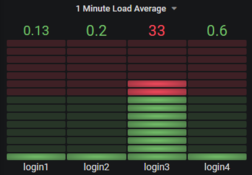 This panel shows the 1 minute load average of the login nodes. |
GPU Allocation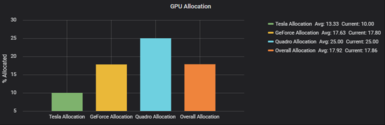 This panel shows the allocated percentage of GPUs per product family and overall. |
Slurm Jobs Started per Minute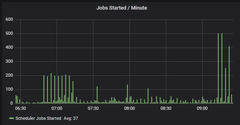 This panel shows the number of jobs started by the Slurm scheduler every minute. |
Dashboard Panels Explained
The dashboard has several restrictions, but there are some areas that can be changed.
Changing the Time Range You are able to change the time range of the dashboard by clicking on the box in the top right corner with the clock icon. Changing the Refresh Frequency You are able to adjust how often the dashboard panels refresh. |
Changing the Partition You can select partitions of interest from the drop down menu at the top left of the dashboard. Maximize a Panel If you want to view only a single panel, simply click on the panel title then click View. |