HiPerGator Metrics: Difference between revisions
| (12 intermediate revisions by the same user not shown) | |||
| Line 1: | Line 1: | ||
{|align=right | |||
|__TOC__ | |||
|} | |||
[[Category:Infrastructure]][[Category:Documentation]] | [[Category:Infrastructure]][[Category:Documentation]] | ||
==Accessing the HiPerGator Status Dashboard== | ==Accessing the HiPerGator Status Dashboard== | ||
#You must have a valid HiPerGator account. If you need to request an account, see the [https://www.rc.ufl.edu/access/account-request/ Account Request] page. | |||
#Use your browser to access https://metrics.rc.ufl.edu | |||
#You will be directed to the UF GatorLink login page (it's possible this step will be skipped if you have already authenticated to other UF resources) | |||
#Once authenticated, you will be shown a Grafana login page | |||
#Enter your GatorLink credentials and click Log In | |||
#You will be directed to the HiPerGator Status dashboard which should have charts like the ones below. | |||
If you do '''not''' land on this page, please contact [mailto:support@rc.ufl.edu Support] or file a [https://support.rc.ufl.edu Bugzilla] ticket. | |||
If you do '''not''' land on this page, please contact [mailto:support@rc.ufl.edu Support] or file a [https://support.rc.ufl.edu Bugzilla] ticket. | |||
==Dashboard Panels Explained== | ==Dashboard Panels Explained== | ||
{|cellpadding="20" | {|cellpadding="20" | ||
|-style="vertical-align:top;" | |-style="vertical-align:top;" | ||
| | | style="width: 50%"| | ||
===[https://metrics.rc.ufl.edu/d/e6ECgorZz/hipergator-status?orgId=2&refresh=5m&var-cluster=hipergator&var-partition=All&theme=dark&viewPanel=2 Number of Users]=== | ===[https://metrics.rc.ufl.edu/d/e6ECgorZz/hipergator-status?orgId=2&refresh=5m&var-cluster=hipergator&var-partition=All&theme=dark&viewPanel=2 Number of Users]=== | ||
[[Image:Num users.png|right | frameless | link=https://metrics.rc.ufl.edu/d/e6ECgorZz/hipergator-status?orgId=2&refresh=5m&var-cluster=hipergator&var-partition=All&theme=dark&viewPanel=2]] | [[Image:Num users.png|right | frameless | x150px| link=https://metrics.rc.ufl.edu/d/e6ECgorZz/hipergator-status?orgId=2&refresh=5m&var-cluster=hipergator&var-partition=All&theme=dark&viewPanel=2]] | ||
This panel shows the number of users per login node.<br> | This panel shows the number of users per login node.<br> | ||
There is a visual threshold set at 75 users. Values over this threshold do not necessarily indicate a problem.<br> | There is a visual threshold set at 75 users. Values over this threshold do not necessarily indicate a problem.<br> | ||
This panel can be used to identify an unbalanced load across the login nodes.<br> | This panel can be used to identify an unbalanced load across the login nodes.<br> | ||
Often, if a node has zero or very few users, it's likely the node is being drained for maintenance purposes and/or has been removed from the pool.<br> | Often, if a node has zero or very few users, it's likely the node is being drained for maintenance purposes and/or has been removed from the pool.<br> | ||
|| | |||
===[https://metrics.rc.ufl.edu/d/e6ECgorZz/hipergator-status?orgId=2&refresh=5m&var-cluster=hipergator&var-partition=All&theme=dark&viewPanel= | ===[https://metrics.rc.ufl.edu/d/e6ECgorZz/hipergator-status?orgId=2&refresh=5m&var-cluster=hipergator&var-partition=All&theme=dark&viewPanel=2 5 Minute Load Average]=== | ||
[[Image: | [[Image:5 min load ave.png|frameless|right | x150px| link=https://metrics.rc.ufl.edu/d/e6ECgorZz/hipergator-status?orgId=2&refresh=5m&var-cluster=hipergator&var-partition=All&theme=dark&viewPanel=2]] | ||
This panel shows the | This panel shows the 5 minute load average of each login node.<br> | ||
A red threshold line has been added to indicate a higher than expected load average.<br> | |||
Being over the threshold does not necessarily imply a problem with that node.<br> | |||
<br> | As with all panels, you can hover your mouse over a point on the line and it will display the value at that point.<br> | ||
If a value is not displayed, move your cursor slightly left or right.<br> | |||
|- | |||
| | |||
===[https://metrics.rc.ufl.edu/d/e6ECgorZz/hipergator-status?orgId=2&refresh=5m&var-cluster=hipergator&var-partition=All&viewPanel=14 CPU Status]=== | ===[https://metrics.rc.ufl.edu/d/e6ECgorZz/hipergator-status?orgId=2&refresh=5m&var-cluster=hipergator&var-partition=All&viewPanel=14 CPU Status]=== | ||
[[Image:Cpu status.png|frameless|right | link=https://metrics.rc.ufl.edu/d/e6ECgorZz/hipergator-status?orgId=2&refresh=5m&var-cluster=hipergator&var-partition=All&viewPanel=14]] | [[Image:Cpu status.png|frameless|right | x150px| link=https://metrics.rc.ufl.edu/d/e6ECgorZz/hipergator-status?orgId=2&refresh=5m&var-cluster=hipergator&var-partition=All&viewPanel=14]] | ||
This panel shows the number of CPUs that are allocated, idle and reserved.<br> | This panel shows the number of CPUs that are allocated, idle and reserved.<br> | ||
It also displays both the current value and average value. Average is calculated based on chosen time range.<br> | It also displays both the current value and average value. Average is calculated based on chosen time range.<br> | ||
| Line 40: | Line 43: | ||
Reserved CPUs are generally unavailable for scheduling and most often are held for system maintenance.<br> | Reserved CPUs are generally unavailable for scheduling and most often are held for system maintenance.<br> | ||
|| | || | ||
===[https://metrics.rc.ufl.edu/d/e6ECgorZz/hipergator-status?orgId=2&refresh=5m&var-cluster=hipergator&var-partition=All&theme=dark&viewPanel= | ===[https://metrics.rc.ufl.edu/d/e6ECgorZz/hipergator-status?orgId=2&refresh=5m&var-cluster=hipergator&var-partition=All&theme=dark&viewPanel=4 1 Minute Load Average]=== | ||
[[Image: | [[Image:1 min load ave.png|frameless|right | x175px| link=https://metrics.rc.ufl.edu/d/e6ECgorZz/hipergator-status?orgId=2&refresh=5m&var-cluster=hipergator&var-partition=All&theme=dark&viewPanel=4]] | ||
This panel shows the 1 minute load average of the login nodes.<br> | This panel shows the 1 minute load average of the login nodes.<br> | ||
It is similar to the 5 minute average but this one can spike higher at times.<br> | It is similar to the 5 minute average but this one can spike higher at times.<br> | ||
| Line 61: | Line 50: | ||
If both the 1 and 5 minute averages are high, then it's possible someone has started a CPU intensive process.<br> | If both the 1 and 5 minute averages are high, then it's possible someone has started a CPU intensive process.<br> | ||
There is also a threshold value set to indicate a higher than expected load.<br> | There is also a threshold value set to indicate a higher than expected load.<br> | ||
|- | |||
| | |||
===[https://metrics.rc.ufl.edu/d/e6ECgorZz/hipergator-status?orgId=2&refresh=5m&var-cluster=hipergator&var-partition=All&theme=dark&viewPanel=12 GPU Allocation]=== | |||
[[Image:Gpu status.png |right | frameless | x125px| link=https://metrics.rc.ufl.edu/d/e6ECgorZz/hipergator-status?orgId=2&refresh=5m&var-cluster=hipergator&var-partition=All&theme=dark&viewPanel=12]] | |||
This panel shows the allocated percentage of GPUs per product family and overall.<br> | |||
It also displays both the current and average allocation, calculated over the chosen time range.<br> | |||
The overall allocation includes all GPU families.<br> | |||
|| | |||
===[https://metrics.rc.ufl.edu/d/e6ECgorZz/hipergator-status?orgId=2&refresh=5m&var-cluster=hipergator&var-partition=All&theme=dark&viewPanel=8 Slurm Jobs Started per Minute]=== | |||
[[Image:Slurm job starts.png|frameless|right | x125px| link=https://metrics.rc.ufl.edu/d/e6ECgorZz/hipergator-status?orgId=2&refresh=5m&var-cluster=hipergator&var-partition=All&theme=dark&viewPanel=8]] | |||
This panel shows the number of jobs started by the Slurm scheduler every minute.<br> | |||
To view the value of a specific point, you can hover your mouse over a bar.<br> | |||
Each bar should display a value.<br> | |||
|} | |} | ||
== | ==Dashboard Panels Explained== | ||
The dashboard has several restrictions, but there are some areas that can be changed.<br> | The dashboard has several restrictions, but there are some areas that can be changed.<br> | ||
{|cellpadding="20" | |||
|-style="vertical-align:top;" | |||
| | |||
===Changing the Time Range=== | ===Changing the Time Range=== | ||
[[ | [[Image:Time range.png|framesless|right | 250px]] | ||
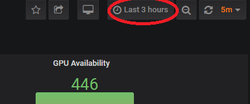
You are able to change the time range of the dashboard by clicking on the box in the top right corner with the clock icon.<br> | You are able to change the time range of the dashboard by clicking on the box in the top right corner with the clock icon.<br> | ||
It is set to a default of the "Last 3 hours". When you click this, you will be presented with several preset options.<br> | It is set to a default of the "Last 3 hours". When you click this, you will be presented with several preset options.<br> | ||
It's best to use one of the presets. Be advised, when using a longer range, the dashboard panels may be more difficult to view.<br> | It's best to use one of the presets. Be advised, when using a longer range, the dashboard panels may be more difficult to view.<br> | ||
<br><br><br> | |||
===Changing the Refresh Frequency=== | ===Changing the Refresh Frequency=== | ||
[[ | [[Image:Refresh.png|framesless|right | 250px]] | ||
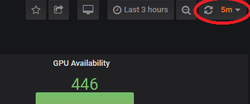
You are able to adjust how often the dashboard panels refresh.<br> | You are able to adjust how often the dashboard panels refresh.<br> | ||
Click the icon in the top right with the refresh icon. It is set to a default of 5 minutes.<br> | Click the icon in the top right with the refresh icon. It is set to a default of 5 minutes.<br> | ||
Be advised, making the refresh interval less than 5 minutes will increase the load on backend servers and may result in poor performance of the dashboard.<br> | Be advised, making the refresh interval less than 5 minutes will increase the load on backend servers and may result in poor performance of the dashboard.<br> | ||
Also, some of the panels are only designed to collect data every 15 minutes, or longer, so shortening the refresh may have little to no effect.<br> | Also, some of the panels are only designed to collect data every 15 minutes, or longer, so shortening the refresh may have little to no effect.<br> | ||
|| | |||
===Changing the Partition=== | ===Changing the Partition=== | ||
[[ | [[Image:Partition box.png|framesless|right | 250px]] | ||
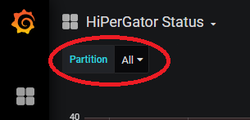
You can select partitions of interest from the drop down menu at the top left of the dashboard.<br> | You can select partitions of interest from the drop down menu at the top left of the dashboard.<br> | ||
Currently, this will only have an effect on the CPU Status panel.<br> | Currently, this will only have an effect on the CPU Status panel.<br> | ||
You may select multiple entries from the selector, or choose All (the default).<br> | You may select multiple entries from the selector, or choose All (the default).<br> | ||
<br><br><br> | |||
===Maximize a Panel=== | ===Maximize a Panel=== | ||
[[ | [[Image:Full screen panel.png|framesless|right | 250px]] | ||
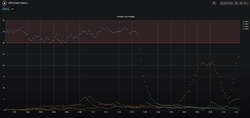
If you want to view only a single panel, simply click on the panel title then click View.<br> | If you want to view only a single panel, simply click on the panel title then click View.<br> | ||
This will present only that panel and fill the entire dashboard making it easier to read.<br> | This will present only that panel and fill the entire dashboard making it easier to read.<br> | ||
|} | |||
Latest revision as of 15:53, 10 January 2023
Accessing the HiPerGator Status Dashboard
- You must have a valid HiPerGator account. If you need to request an account, see the Account Request page.
- Use your browser to access https://metrics.rc.ufl.edu
- You will be directed to the UF GatorLink login page (it's possible this step will be skipped if you have already authenticated to other UF resources)
- Once authenticated, you will be shown a Grafana login page
- Enter your GatorLink credentials and click Log In
- You will be directed to the HiPerGator Status dashboard which should have charts like the ones below.
If you do not land on this page, please contact Support or file a Bugzilla ticket.
Dashboard Panels Explained
Number of Users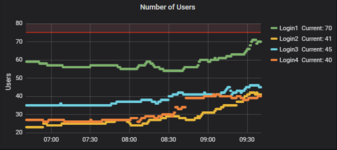 This panel shows the number of users per login node. |
5 Minute Load Average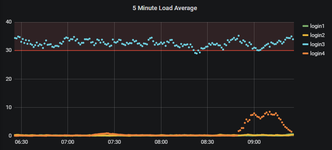 This panel shows the 5 minute load average of each login node. |
CPU Status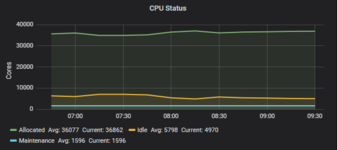 This panel shows the number of CPUs that are allocated, idle and reserved. |
1 Minute Load Average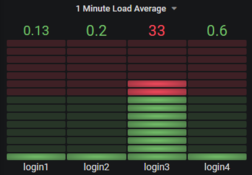 This panel shows the 1 minute load average of the login nodes. |
GPU Allocation This panel shows the allocated percentage of GPUs per product family and overall. |
Slurm Jobs Started per Minute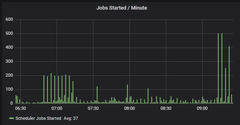 This panel shows the number of jobs started by the Slurm scheduler every minute. |
Dashboard Panels Explained
The dashboard has several restrictions, but there are some areas that can be changed.
